1 (866) 212-6717 info@amgenvironmental.com
Data Hosting
SECURely stored, easily accessible
web based data & analytics
AMG LIVE is an online web based data analytics tool. Data collected is securely stored on redundant servers behind a full Unified Threat Management (UTM) firewall, and the entire system is backed up daily using a managed backup system. Our clients can log in at any time to view data collected for their project. Data can be laid out nicely in line or scatter plot graphs. Tabular forms are also available, including analytical data tables.
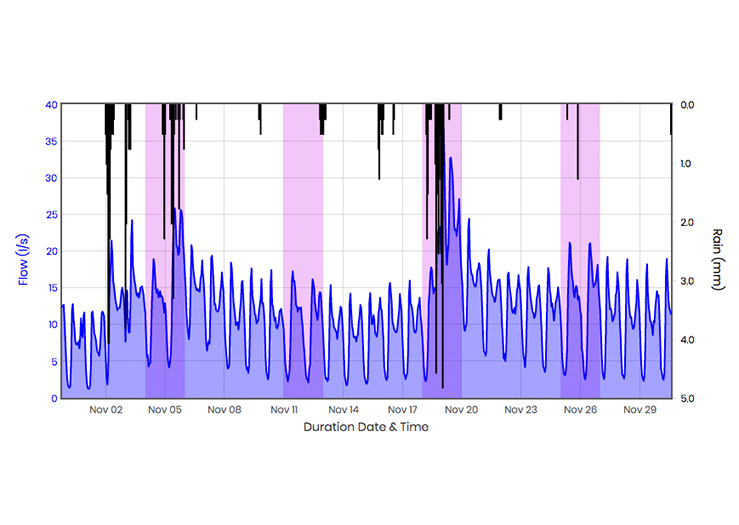
Intuitive Graphing Engine
The graphing engine is extremely intuitive whereby the user can select to view their data in many different intervals, which instantly adjusts the resolution and the number of data points being viewed. The user can zoom in or hover over any point on the graph to see detailed information. Line and Scatter Plot graphs are available when viewing the data set.
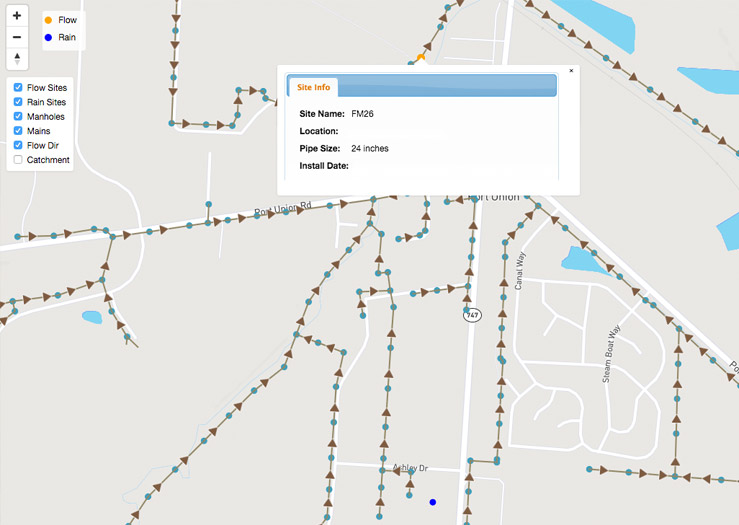
GIS Analytics Map
Overlay all your Flow Sites and Rain Sites on 1 GIS map. Our team can fully customize your GIS map to show any attributes from your uploaded GIS shape files which are viewed by hovering over the node. Turn on and off the layers to view exactly what you want.
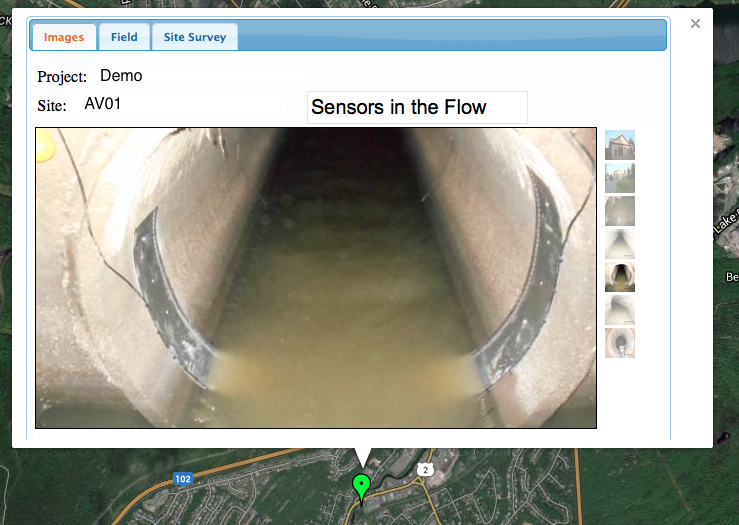
View Sites On Google Maps
Overlay all of your sites on top of the Google map. The pin color will let you know the connectivity of the monitor to the host server. Click on the pin to get access to more site specific information and photos.
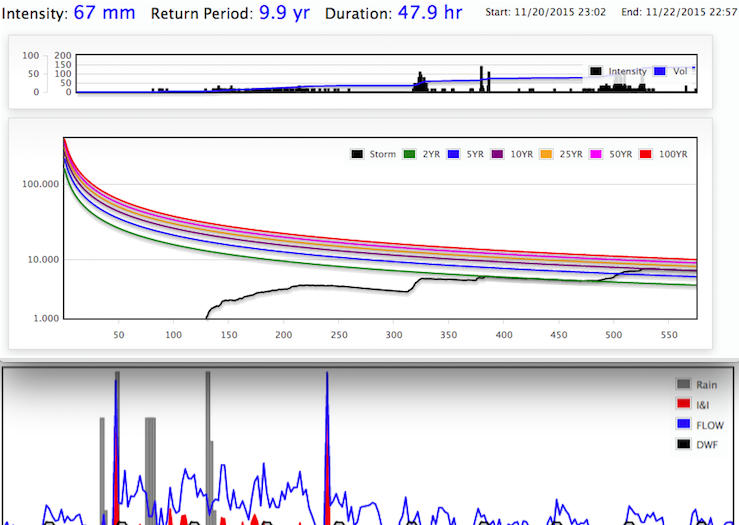
Online Reporting Tools
Online reporting tools to assist in flow data analysis. With the IDF tool you can have your local IDF curve uploaded to your project, then overlay your rainfall data to determine the storm return period. The I&I tool is there to assist with calculating Inflow and Infiltration using your flow data.
Here’s What You’ll See When You Log In:
- Site Documentation
Information Sheets - Site Photos
- Field Calibration
Forms - GIS Map
- Various Analytical
Tools